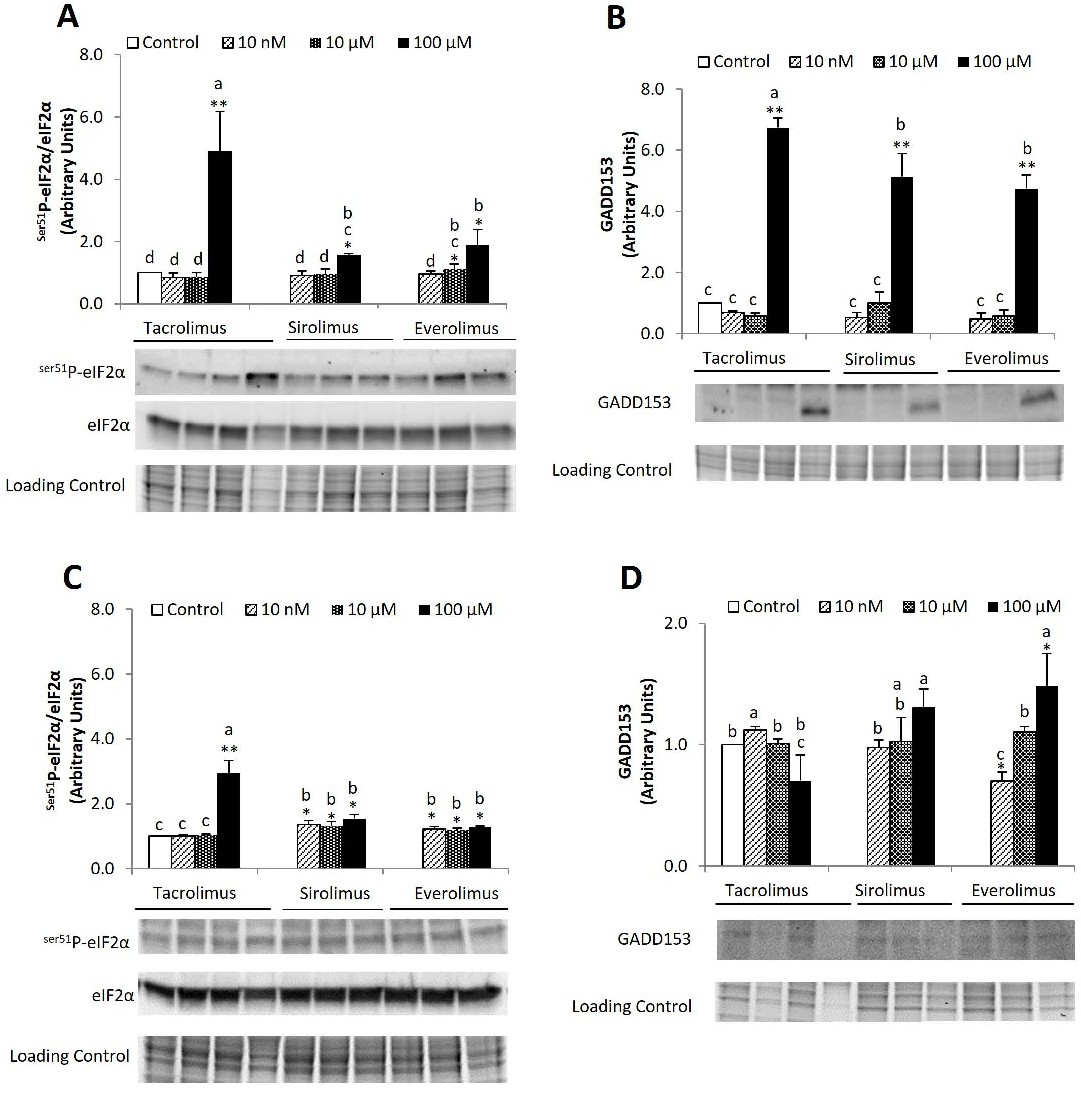
Fig. 2. Ser51P‐eIF2α/eIF2α ratio and GADD153 protein expressions in Tacrolimus-, Sirolimus- and Everolimus-treated HepG2 (A and B, respectively) and Huh7 (C and D, respectively) cells. Treatments were administered at different concentrations (0, 10 nM, 10 µM, and 100 µM). The expression of Ser51P‐eIF2α and eIF2α (3 h), and GADD153 (12 h) was evaluated by Western‐blot analysis as described in Material and Methods. Results are expressed as mean ± SEM, and blots are representative of five independent experiments. *p ≤ 0.05 and **p ≤ 0.01 between control and immunosuppressant‐treated cells. The groups with different letters (a, b, c or d) were significantly different (p ≤ 0.05).